
See a card’s price and supply history
We made several improvements to the sales charts on Mana Pool:
- Full history is charted, not just the most recent 100 sales.
- Added supply history graphs.
- Styled and smoothed the graphs to be less noisy.
Full price history
Price history charts now show the full history for a card. This applies to individual printings and card rollup pages.
Previously, the charts were limited to the table we show for Recent sales (the latest 100 sales), but now the graphs go all the way back. Vivi Ornitier, for example, now shows sales back to June 2025.
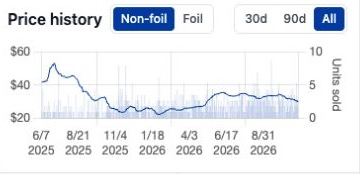
Price history for Vivi Ornitier, captured on November 9.
Supply history
We’ve also added a Supply history graph. It shows recorded daily available copies on Mana Pool across all finishes, conditions, and languages for that printing or card.
The graph below shows supply for Llanowar Elves from Dominaria. On card rollup pages, supply history totals the available copies across all printings, finishes, conditions, and languages.
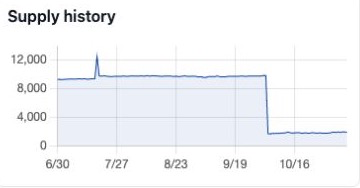
Supply history for the Dominaria printing of Llanowar Elves, captured on November 9.
Less noisy graphs
We styled and smoothed the graphs to make trends easier to read. Longer histories use quantity-weighted rolling averages.
Choose a finish and date range
The price chart now shows one finish at a time. Choose Non-foil or Foil when both have sales history, then use 30d, 90d, or All to choose the period. The bars show daily units sold alongside the average-price line, with a separate units axis.
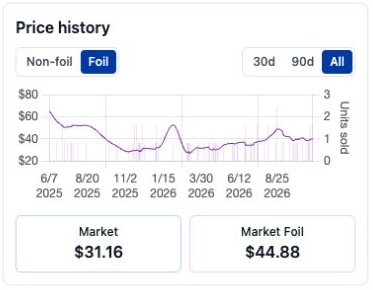
Vivi Ornitier with Foil and All selected, captured on Mana Pool on November 2.
If a selected finish and period have no sales, the chart shows an empty state. All is the default period.