
Track your Unique sales and listing views
Sellers can now see their Unique card sales and listing views in the Unique sales dashboard.
The monthly charts show sales amounts and items sold over the last 12 months. Open Monthly totals to see the numbers in a table. Months use UTC and include the current partial month. Sales amounts exclude shipping, tax, reported items, and failed verifications. They aren’t net payouts.
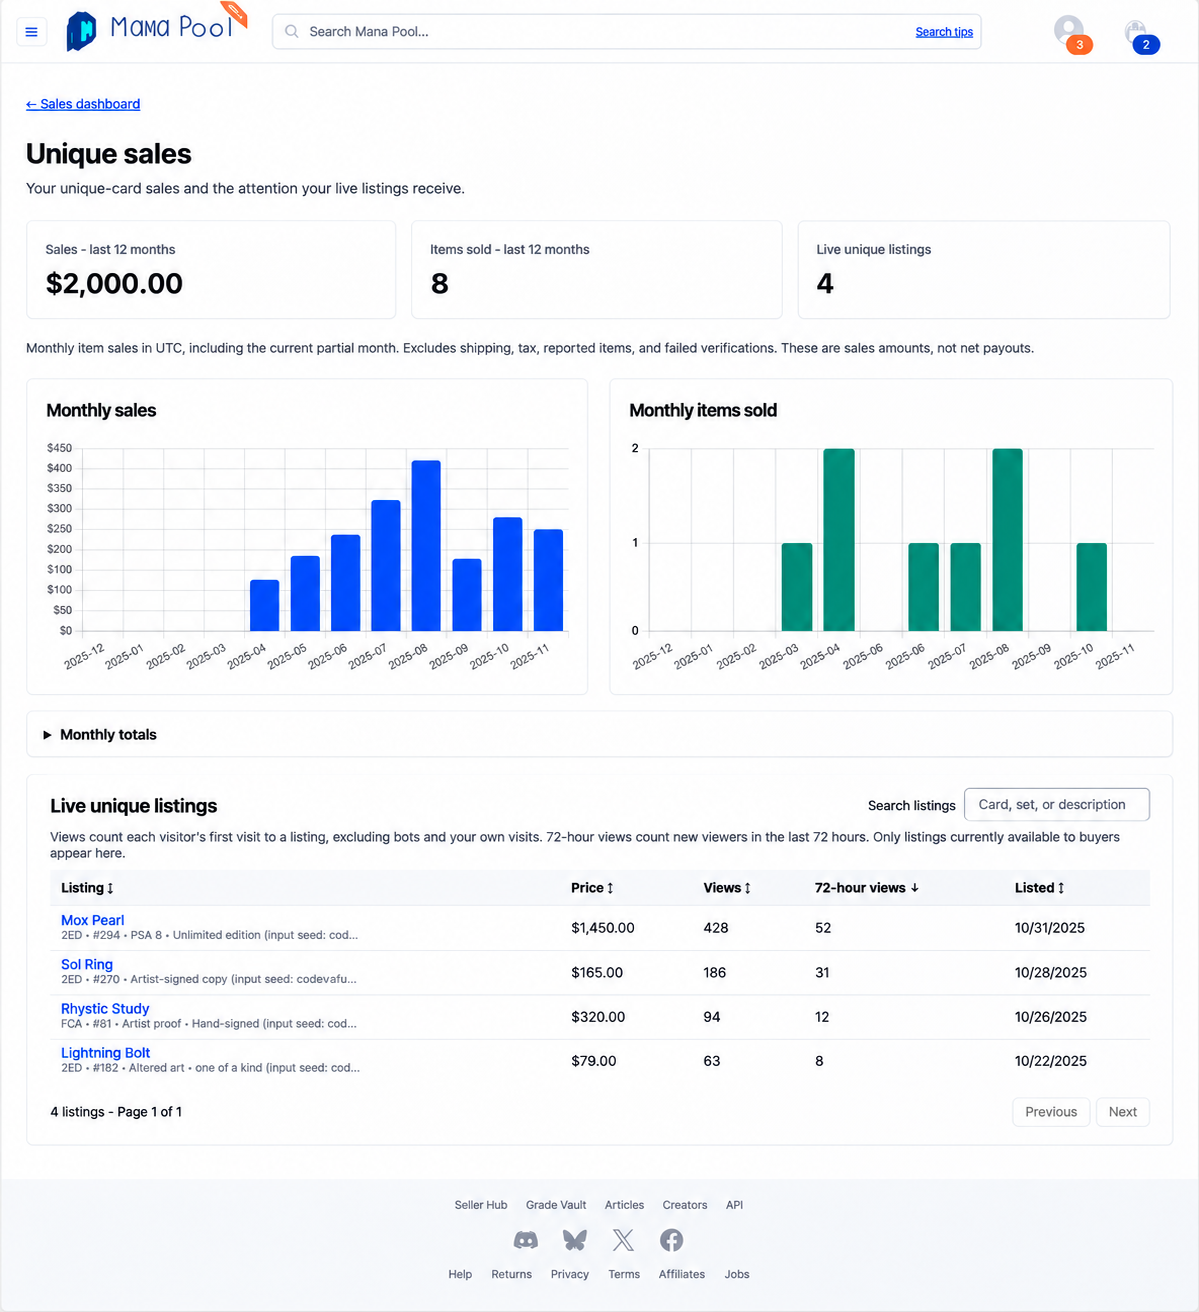
Illustration with sample sales and listings. These aren’t a seller’s actual results.
See which listings are getting attention
Below the charts, search your live Unique listings or click a column heading to sort by price, views, new viewers over the last 72 hours, or listing date.
Views count each visitor’s first visit to a listing, excluding bots and your own visits. The 72-hour column counts new viewers during that window, not repeat visits. Only listings currently available to buyers appear in the table.
Click a listing to see its details, then use View in inventory to open its inventory page or View live listing to see the public listing.